- Explainers
- Explainer video styles
- Data-journalism dark
Explainer video style · Data-journalism dark
Data visualization explainer videos
Editorial charts on charcoal, precise and calm. Brief it in one sentence and get a narrated, animated explainer film in the Data-journalism dark style, scored and voiced, in about 15 minutes.
Or let the director choose a style for your topic.
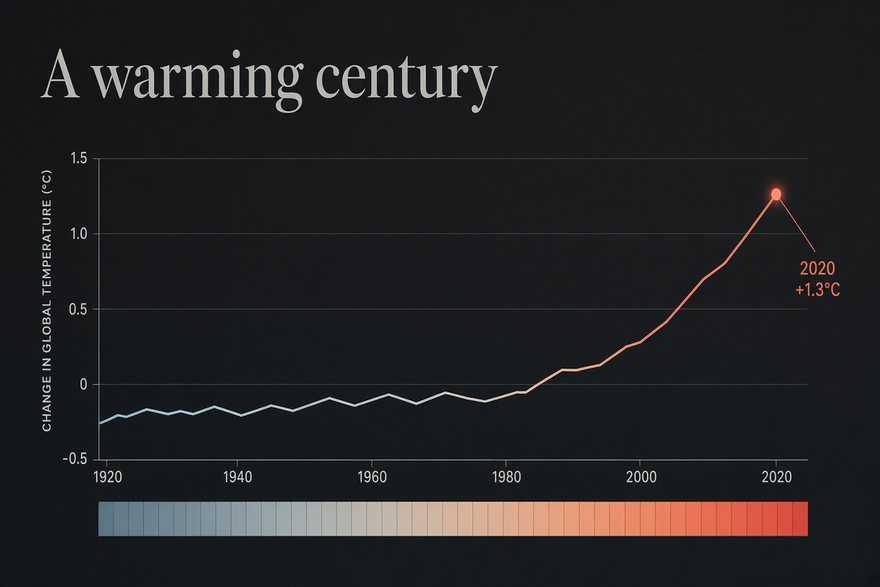
What it looks like, and when to use it.
Precise editorial charts on deep charcoal, with one warm accent, one cool accent, elegant serif headlines and calm motion, like a top newspaper’s data feature. Data-journalism dark is drawn in code, so numbers and charts are exact. It is the style for evidence.
Best for
- Reports, research and results
- Investor and board updates
- Talks that rest on numbers
Try a brief like
- “How global temperatures changed since 1900”
- “What our survey found”
- “Where a country’s budget goes”
The art direction the director follows.
Every style is a full art direction, not a filter: its own palette, type, motion and music. This is the brief the director works from for Data-journalism dark.
- Look
- Drawn in code, no generated images: premium editorial data-journalism graphics on a deep charcoal ground, like a top newspaper's interactive feature — precise thin lines, restrained palette of one warm accent and one cool accent plus greys, elegant serif headlines, small sans-serif annotations with leader lines, a subtle baseline grid, spacious layout. Scenes are minimal vector illustrations, maps and charts.
- Motion
- Scrollytelling on a locked camera: charts build as the narration names them (axes first, then data drawing along, then the annotation); emphasis comes from the data itself — the key point brightens and grows while the rest dims to grey. The frame stays fixed so axes and numbers never slide while they are being read.
- Music
- Calm modern: soft piano motifs over subtle electronic textures and light pulses — thoughtful, trustworthy.
- Type
- Elegant serif for headlines (Tiempos/Source Serif-like), clean sans for annotations and numbers with tabular figures.
22 more styles. Or let the director choose.

Editorial collage

Risograph print

16-bit pixel art
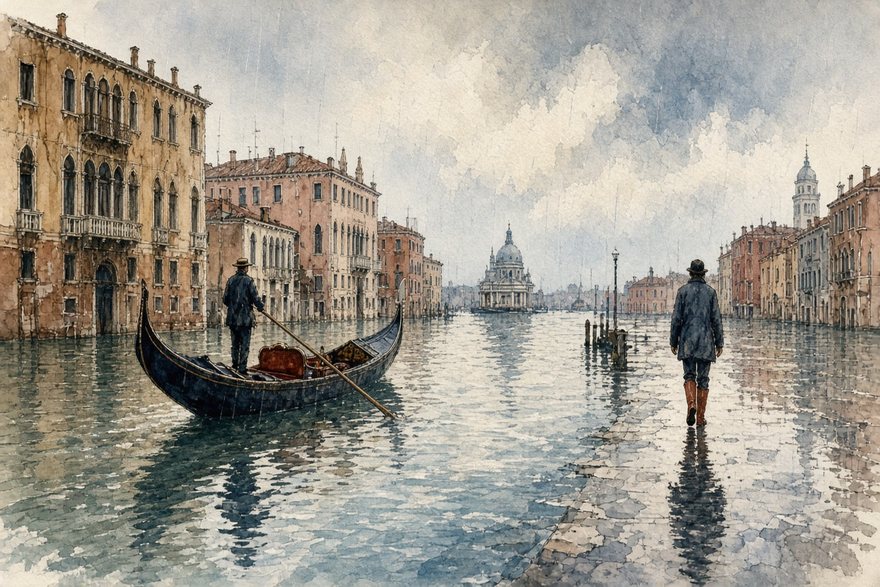
Watercolor editorial
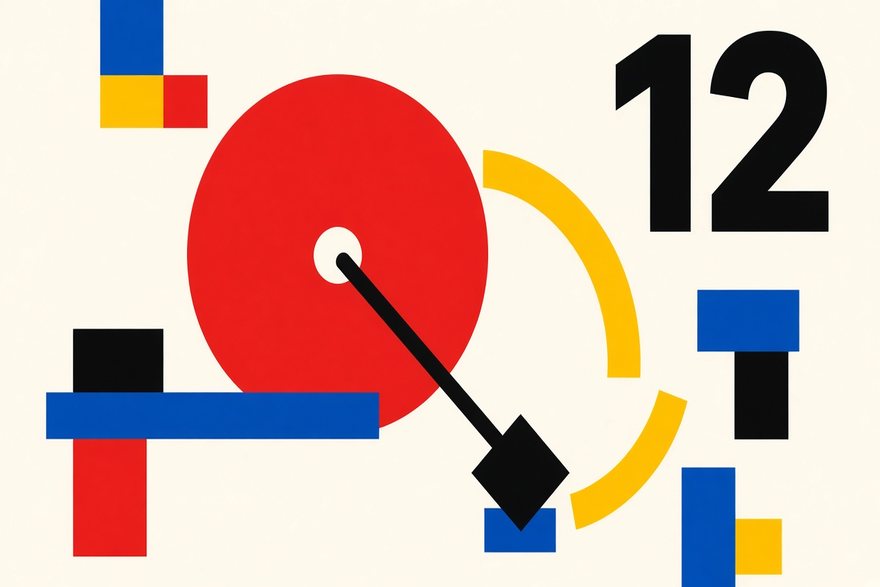
Swiss modernist

Archival documentary

Claymation look

Neon synthwave

Ukiyo-e woodblock
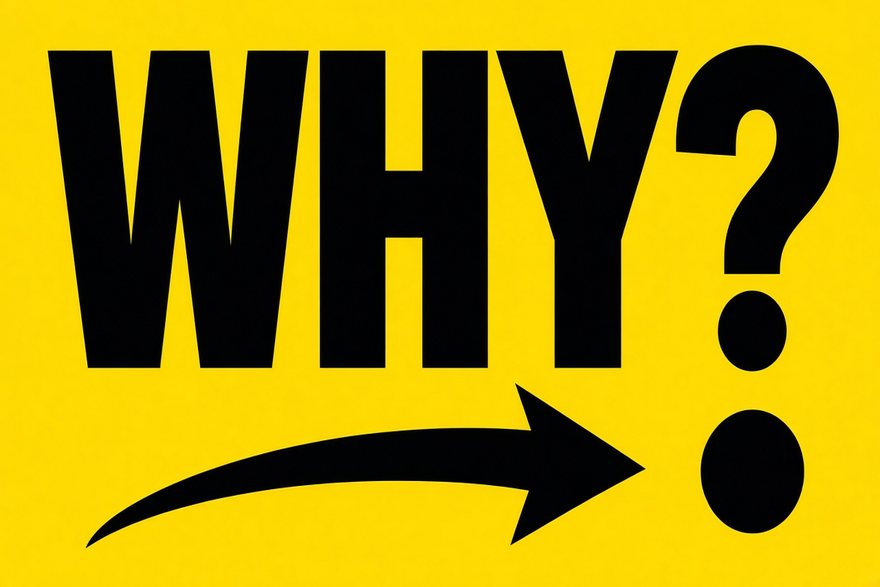
Kinetic typography

Felt & yarn craft

Pop comic book

Blueprint / technical
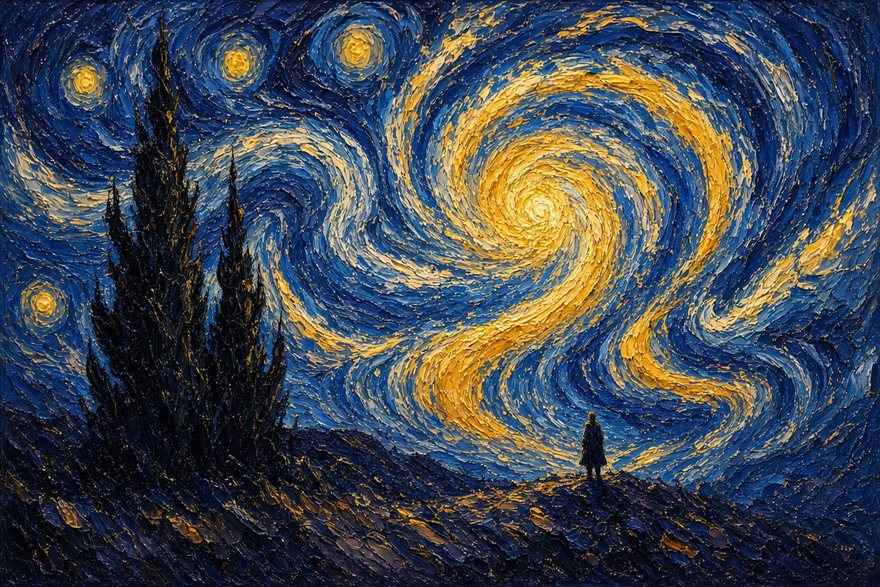
Oil impasto

Isometric low-poly

Ink noir + one colour

Layered papercut

Mid-century cartoon

Whiteboard doodle

Nature documentary

Bold flat vector
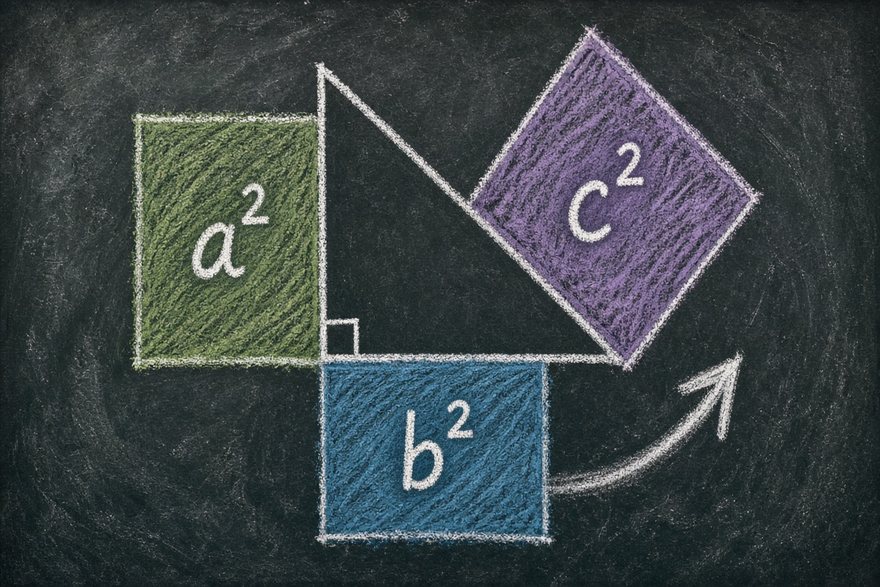
Chalkboard lesson
One sentence is enough.
Describe your topic, approve the storyboard, and get a narrated, animated film in about 15 minutes. Explainers is invite-only for now: sign in and tell us what you want to explain.
Make an explainer in this style